Computer Graphics: Bresenham’s Line Generation Algorithm
Joining two points on any 2 dimensional plane results a line segment. Unfortunately, we can not obtain a line or join two co-ordinate points in Computer Graphics. What we can do is find the intermediate points between these two points and put a pixel for each intermediate points with a desired color.
The computer graphics function uses the output screen as a coordinate system. The TOP-LEFT corner is considered origin(0, 0). On moving right, the x-ordinate increases and on moving down, y-ordinate increases.
What is Bresenham’s Line Generation Algorithm ?
It is an incremental scan conversion algorithm. The big advantage of this algorithm is that, it uses only integer calculations. Moving across the x axis in unit intervals and at each step choose between two different y coordinates.
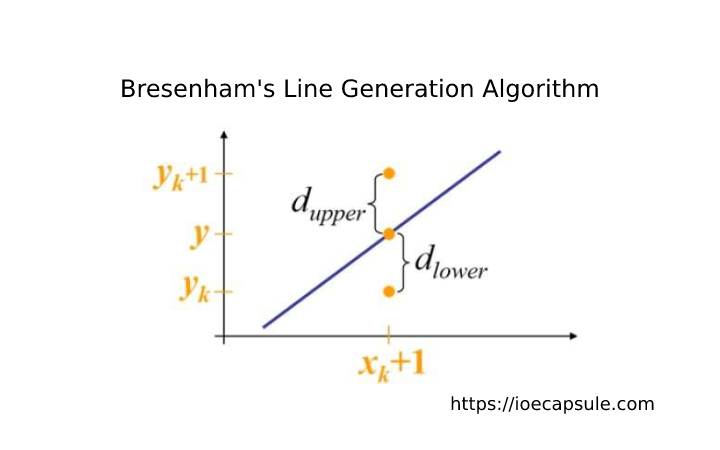
Bresenham’s Line Generation Algorithm
StartInput two line end-points and store the left end point at (x1, y1) and right end-point at (x2, y2)Calculate delta(x) and delta(y) :
delta(x) = x2 - x1
delta(y) = y2 - y1Calculate initial decision parameter as
p0 = (2 * delta(y)) - delta(x)if(x2 > x1) then
set x = x1
y = y1
else
x = x2
y = y2Draw pixel at (x, y)If(delta(x) > delta(y)) i.e. |slope| < 1 then
compute p0 = 2 * delta(y) - delta(x)
else
jump to step 9Starting at k = 0 to delta(x) times, repeat
if(pk < 0)
x(k+1) = x(k) + 1
y(k+1) = y(k)
p(k+1) = p(k) + 2*delta(y)
else
x(k+1) = x(k) + 1
y(k+1) = y(k) + 1
p(k+1) = p(k) + 2*delta(y) - 2*delta(x)
plot(x(k) + 1, y(k) + 1)if(delta(y) > delta(x)) i.e. |m| > 1, then
p0 = 2*delta(x) - delta(y)
else
jump to step 10Starting at k = 0 to delta(y) times, repeat
if(p(k) < 0)
x(k+1) = x(k)
y(k+1) = y(k) + 1
p(k+1) = p(k) + 2*delta(x)
else
x(k+1) = x(k) + 1
y(k+1) = y(k) + 1
p(k+1) = p(k) + 2*delta(x) - 2*delta(y)
plot(x(k)+1, y(k)+1)Stop
Example Problem Of Bresenham’s Line Generation Algorithm :
Digitize a line with end points (10, 15) and (15, 18) using BLGA :
delta(x) = |15 – 10| = 5
delta(y) = |18 – 15| = 3
|m| = |3/5| < 1
p0 = 2*delta(y) – delta(x) = 2*3 – 5 = 1
since, x2 > x1,
x = x1 = 10
y = y1 = 15
pk = delta(x) * (d1 – d2) : if (d1 – d2) > 0, choose d2 else choose d1.
if p(k) < 0, p(k+1) = p(k) + 2*delta(y) and plot the pixel(x(k)+1, y(k)+1)
if p(k) > 0, p(k+1) = p(k) + 2*delta(y) – 2*delta(x) and plot the pixel (x(k)+1, y(k)+1)
Here, p0 = 1 i.e. p(k) >= 0
p1 = p(k) + 2*delta(y) – 2*delta(x) = 1+6-10 = -3
p1 < 0 so,
p2 = -3 + 2*3 = 3
p2 >=0 so,
p3 = -1
p3 < 0 so,
p4 = 5
Hence,
| k | x | y | p(k) | plot the screen |
| 0 | 10 | 15 | 1 | (11, 16) |
| 1 | 11 | 16 | -3 | (12, 16) |
| 2 | 12 | 16 | 3 | (13, 17) |
| 3 | 13 | 17 | -1 | (14, 17) |
| 4 | 14 | 17 | 5 | (15, 18) |